
From Weather Patterns to Preparedness: Understanding El Niño Impacts Across Central Appalachia
On August 13th, NOAA’s Climate Prediction Center issued its latest projections for El Niño conditions—identifying a trend towards very strong El Niño conditions later this year (1). These findings have generated bold headlines about a “super” El Niño, some of which blur the lines between fact and hyperbole.
It’s true: the chance of seeing a very strong El Niño event by October-December has increased to above 90%, as shown in Figure 1, and it does have implications for Central Appalachian communities.
What’s also true: the impacts for Central Appalachia don’t exactly mirror those making national headlines and can be difficult to parse out. It’s important to unpack what this means for our region to effectively invest time and resources in helping communities prepare for potential hazards.
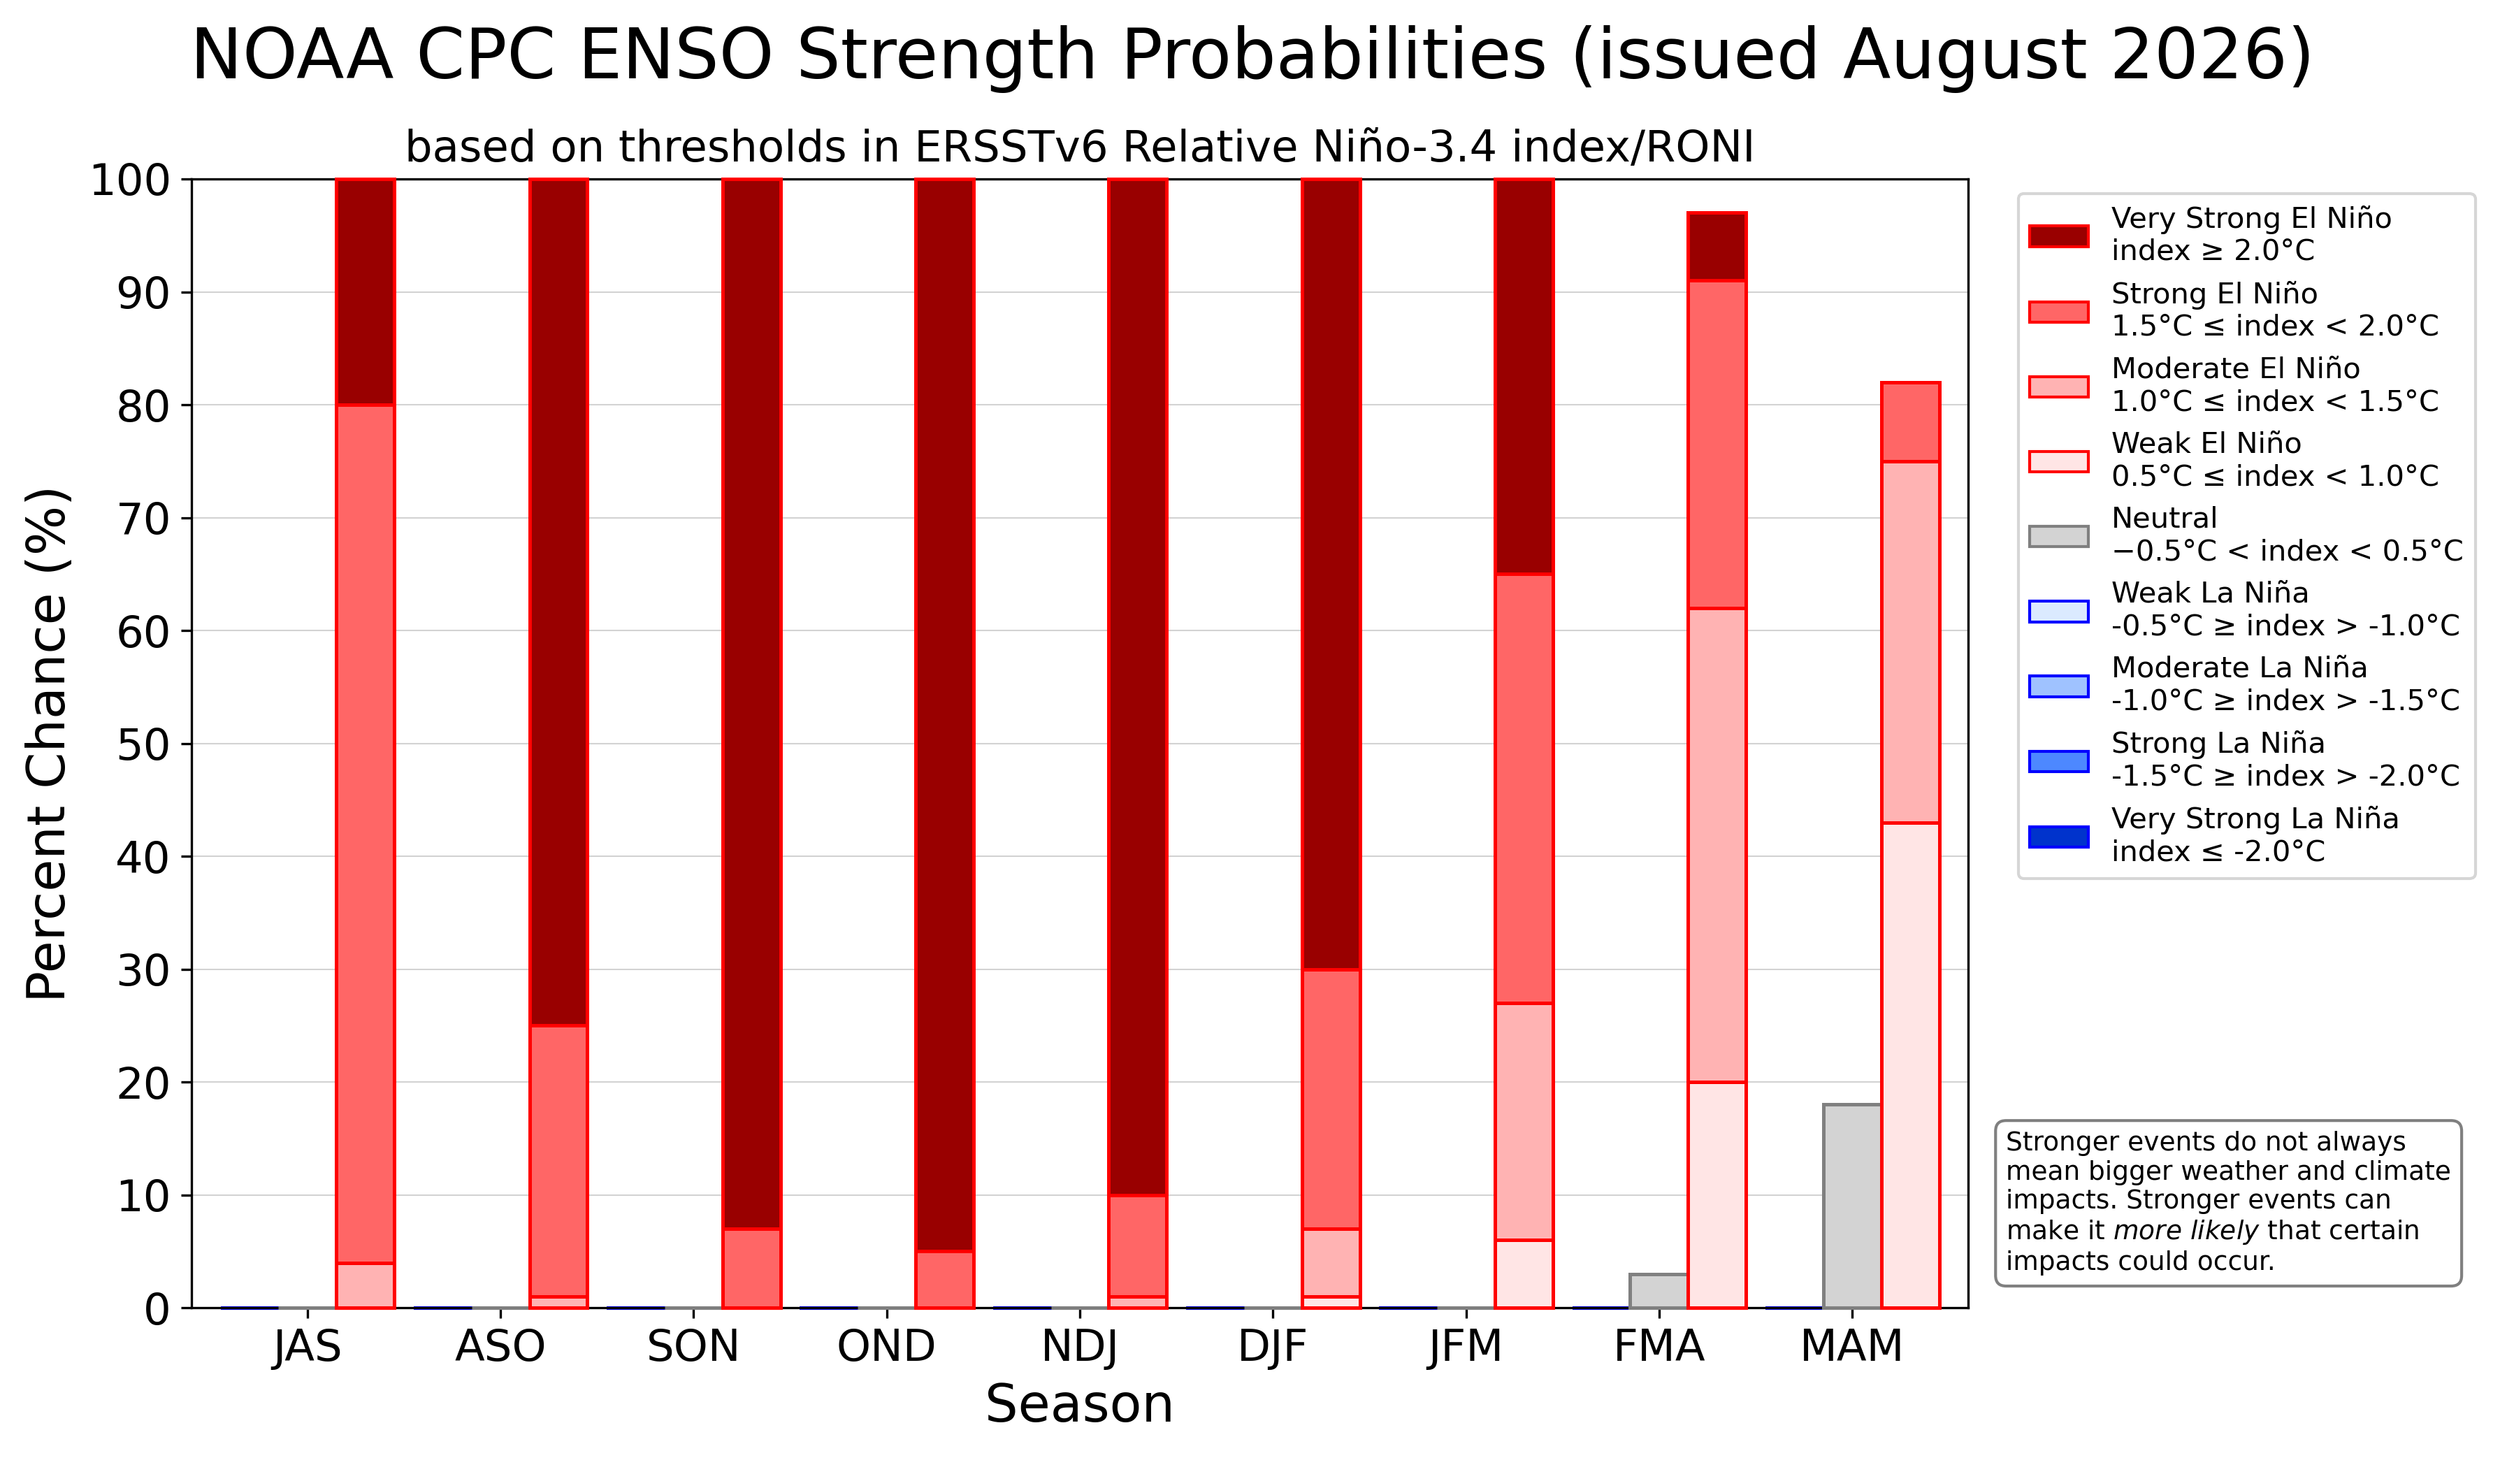
Figure 1 shows the likelihood of El Niño (dark red bars), Neutral (grey bars), and La Niña (blue bars)—indicating that from September to December, chances of a “very strong” El Niño reach above 90%.
What is El Niño, anyway?
El Niño is a major climate pattern that occurs when temperatures in the equatorial Pacific Ocean are 0.5°C (0.9°F) above average for several consecutive months. The higher the temperatures rise above average, the more intense the El Niño pattern becomes. A “super” El Niño is reached when equatorial Pacific temperatures rise 2.0°C above average.
The warmer water conditions that drive El Niño cause the jet stream to move south of its typical position, hugging the Gulf Coast, as illustrated in Figure 2. Broadly, southern communities in the U.S. are exposed to wetter conditions, while communities in the northern half of the country experience warmer and drier air patterns (2).
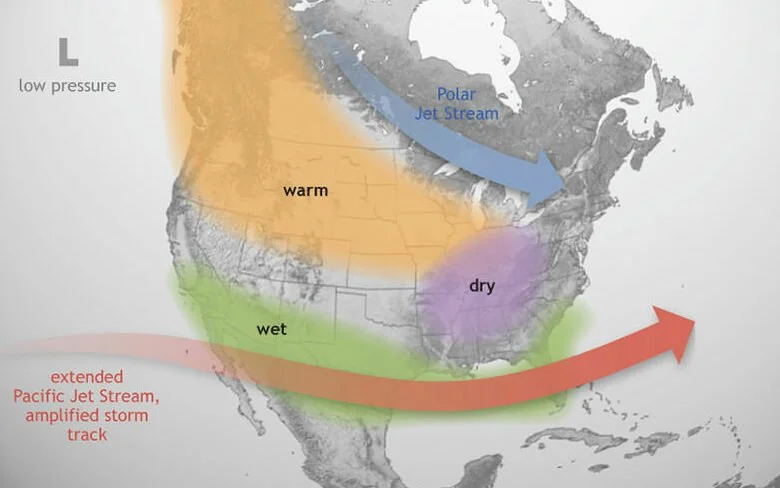
Figure 2 visualizes how the extended Pacific Jet Stream pushes moist air through the southern half of the U.S. and Gulf Coast, while warm, drier air is ushered down to the northern half of the Country.
What does this look like in Central Appalachia?
The impacts of El Niño weather patterns can’t be easily boiled down to single characteristics like "wet" or "dry," "warm" or "cold." Effects shift seasonally, never occur in isolation, and vary even between places that are nearby as the crow flies.
“For the southern Appalachian region, these effects are generally not as pronounced as places closer to the Ohio River Valley or the Gulf.” says Brandon Wasilewski, a National Weather Service (NWS) Meteorologist based in Morristown, Tennessee. “Below normal precipitation can be favored, but this is seen more to the north. Places to our south usually see more above-normal precipitation because of the Pacific jet stream. ”
As we move further north, the pattern shifts. “West Virginia is typically in the dividing line between.” according to Tony Edwards, a National Weather Service Warning Coordination Meteorologist based in Charleston, WV. “So we’re kind of in the middle, but typically there is a trend for a drier than normal conditions, with generally below normal precipitation.”
This year, NOAA has estimated that we are more likely to see a “below normal” level of tropical storm and hurricane activity. “During the summer, El Niño conditions do keep the tendency for hurricanes to develop a little below normal.” Edwards continues.
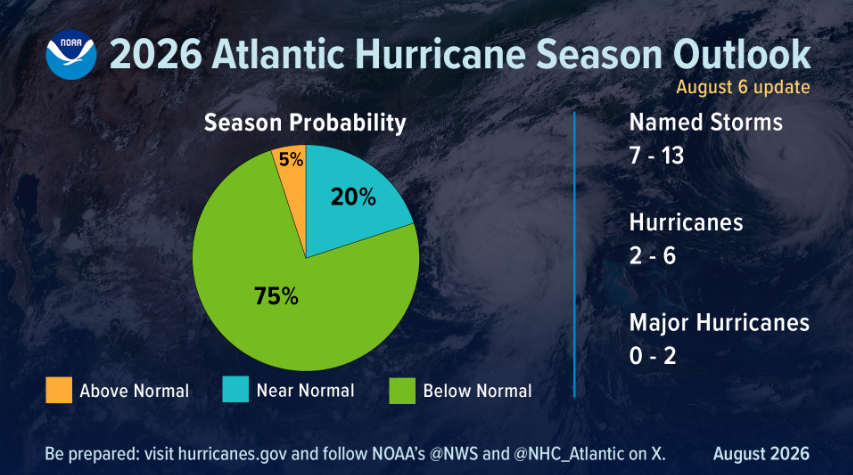
Figure 3 showcases the likelihood of tropical storm and hurricane activity in 2026—with a 55% chance we will see conditions below average.
With the 2-year anniversary of Hurricane Helene approaching, many in Appalachia are wary of the Atlantic Hurricane season. El Niño patterns drive upper-level wind shear that discourages tropical storm and hurricane formation in the Atlantic (3). This doesn’t mean hurricanes won’t form, but generally, lower-than-average levels of tropical activity can be expected.
”The wintertime months are when El Niño has its biggest impact on our region. Typically, it's a drier than normal winter.” Edward remarks, “But it can be punctuated with some bigger winter storms if the storm track matches up just perfect with all that moisture south, and the colder air to the north. So something to watch.”
The pattern Edwards is referring to has played out before, when a very strong El Niño amplified Winter Storm Jonas in 2016, a deadly blizzard which brought over 40” of snowfall in parts of West Virginia—and notable impacts for Virginia, Kentucky, Ohio, and the northeast (4).
“It's a lot of uncertainty.” Overall, Edwards emphasizes the need for communities and local leaders to continually check weekly forecasts to stay alert for hazard risk. “It all depends right exactly on where those jet streams set up, and those vary week by week.”
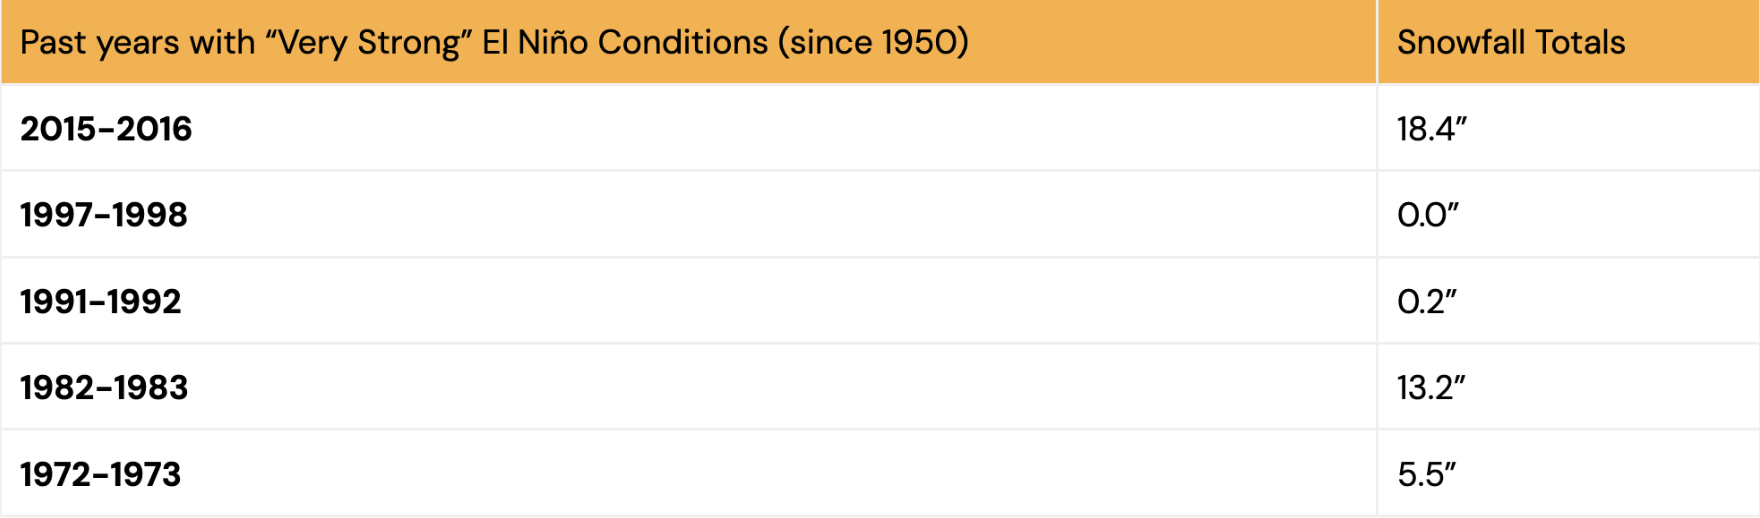
Figure 4 summarizes snowfall totals shared from the Morristown, TN NWS across five previous “very strong” El Niño years in the Tri-Cities area—TN, VA, and KY.
Wasilewski shared data validating the variation communities can experience. For example, the Tri-Cities area in eastern TN saw vastly different snowfall totals over the last five “very strong” El Niño winters (Figure 4).
Both Wasilewski and Edwards emphasize that El Niño is only one piece of the puzzle. Other atmospheric climate patterns can significantly influence how El Niño conditions unfold in Central Appalachia by shaping Arctic air movement, storm tracks, temperature, and precipitation.
Does El Niño impact more than just weather?
Very strong El Niño events cause diverse, global impacts on precipitation and temperature and, as a result, drought. The direct effects for communities can stem beyond local weather, and are often felt by the ripple effect that drought and rainfall have on global agricultural yields and impacts on supply chains.
Many journalists are drawing frightening parallels to the 1876-1878 famine, which occurred alongside a Super El Niño event and caused an estimated 50+ million deaths due to failing agricultural systems across Asia, Africa, and Brazil. However, the scale of this tragic episode was the result of unique, compounding weather, social, and political dynamics that amplified El Niño's impacts on food systems (5).
As we learn from history, we can apply the same risk analysis to our current geopolitical and economic conditions. For example, global energy supply and fertilizers are already under strain due to conflict in the Middle East and Eastern Europe and could face additional disruption from El Niño (6). This will arrive alongside the varied impacts farmers, ranchers and growers can anticipate depending on local drought or precipitation conditions in their area. The net result is likely to be more pressure on domestic energy and food prices, with rural and food-insecure communities facing the greatest impact.
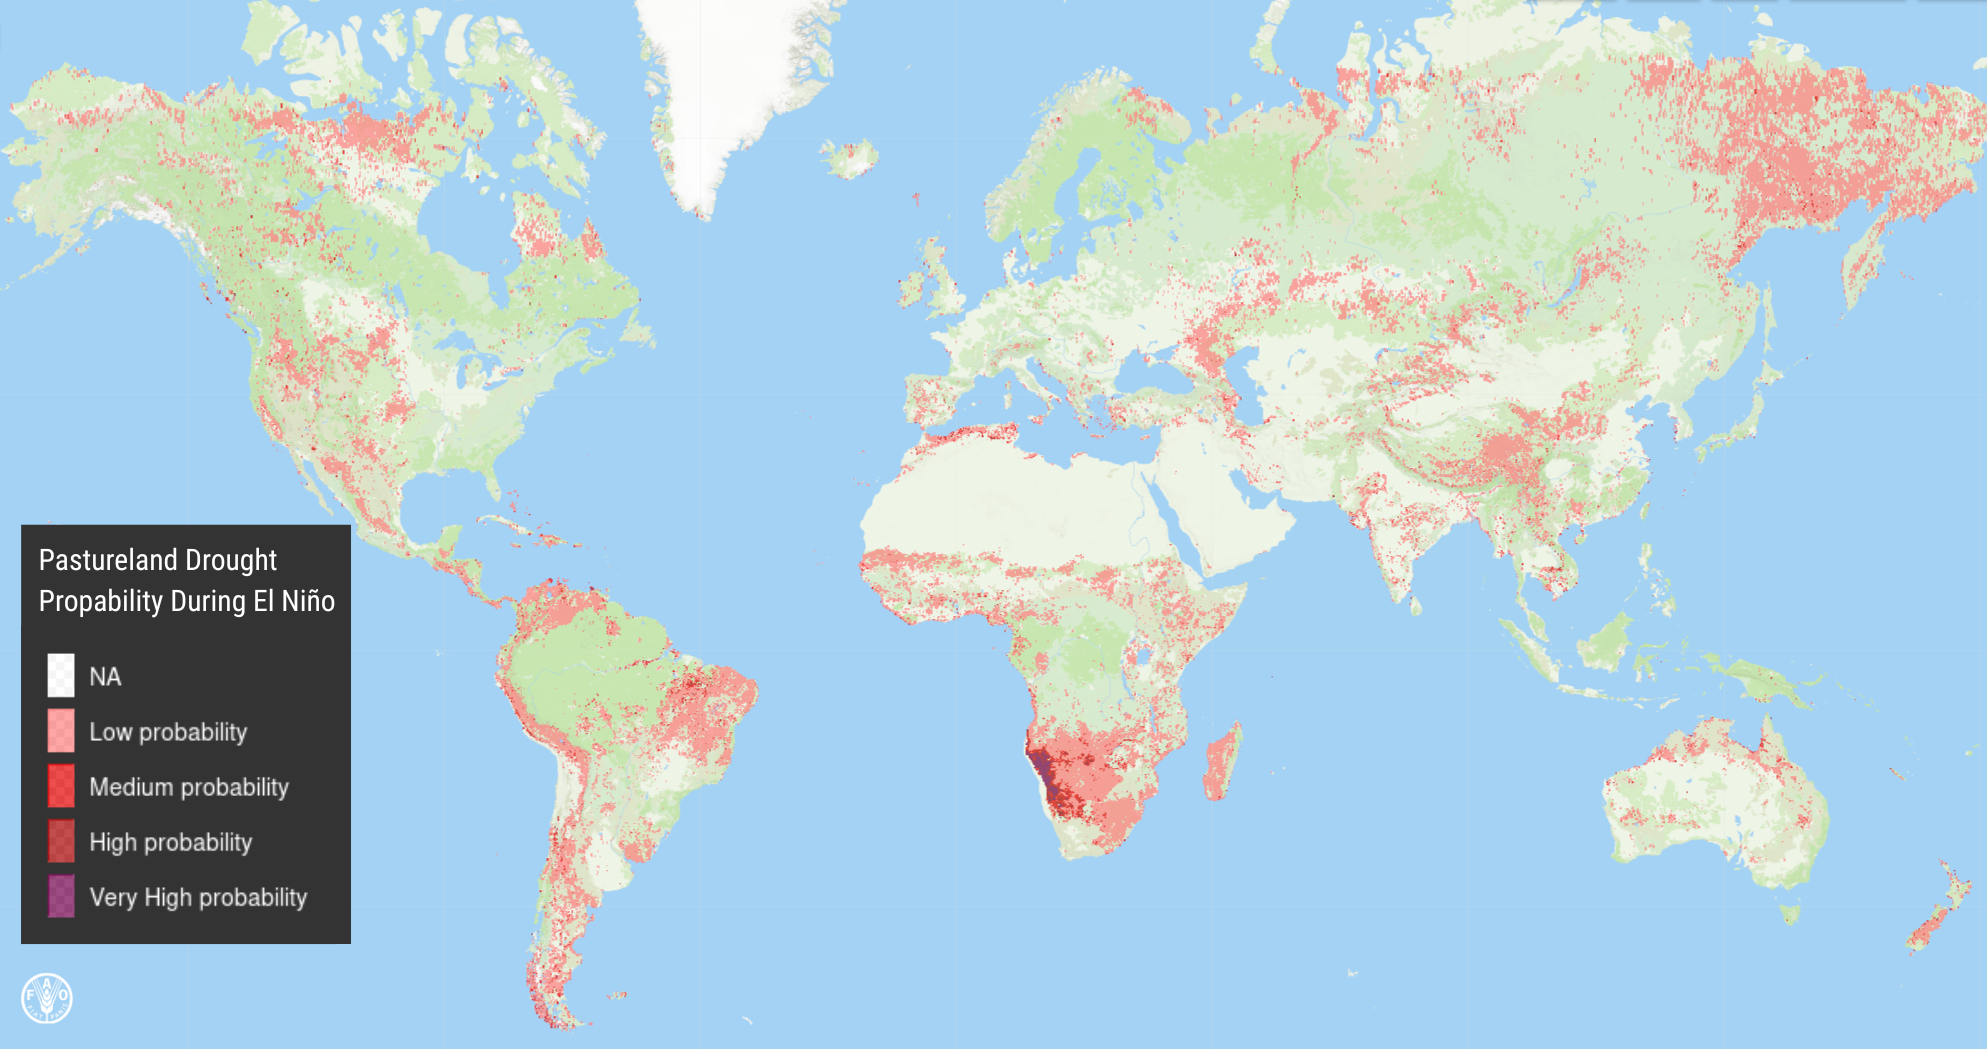
Figure 5 depicts the FAO’s El Niño drought prediction globally, showing where pasture land is expected to be most impacted.
In the midst of this uncertainty, new predictive technologies are helping guide mutual aid, government response, and investment—such as the UN’s Food and Agriculture Organization’s (FAO) new drought prediction tool, which helps anticipate specific agricultural impacts expected during El Niño (Figure 5). This data is helping shape how the FAO and World Food Programme will deploy a requested $202 million to proactively support high-risk agricultural systems in 22 countries (7).
Translating Weather Signals into Action: Areas for Preparedness and Investment
Funders and Donors
With an increased likelihood of systemic shocks, specifically impacting food security and essential community needs, funders should begin proactively engaging their grantees and community partners to determine how their grantmaking budgets can mitigate risk, including setting up reserves for rapid deployment for things such as:
Food access programs, or food donations for mutual aid networks;
Supplements to support growers who may experience crop or livestock impacts;
Programs to support growers working on drought-adaptive practices and crop diversification;
Drinking water reserves and longer-term household-level solutions (like water filtration systems, well pump replacements, or storage tanks).
Mutual Aid Networks + Community Based Organizations
Mutual aid networks and community based organizations have long been the first and most trusted responders when hazardous weather occurs or compounding conditions cause resource shortages. As a result, much of the infrastructure and relationship-building needed to weather the possible systemic effects of El Niño is already in place—but additional preparations can help crews anticipate where community needs might further ramp up this year:
Building or re-establishing relationships now with regional funders and donors so that rapid-response requests aren't the first point of contact, alongside documenting existing capacity (volunteer rosters, supply inventories, communication trees) in a form that can be shared quickly with funders seeking to direct emergency resources;
Testing or continuing to build communication protocols for power and cell outages possible from extreme storms;
Continue to focus on building food and water supply reserves, and additional supplies to support building winter weather preparedness kits;
With extreme winter weather possible—mapping or cross-checking routes into isolated communities in advance, since a single road closure can strand households that mutual aid volunteers would otherwise reach quickly.
Local Emergency Managers & Infrastructure Operators
As local emergency managers, responders, and volunteers prepare for the possibility of extreme storms and winter weather, it’s critical to update and review response plans before the season, work with mutual aid networks and community members to identify accessible warming shelters or resilience hubs (if power goes out), and strengthen communications with vulnerable or remote residents.
Additionally, water system operators, county officials, and state agencies should be coordinating now on contingency planning if drought or excessive precipitation causes water supply contamination, especially in areas that are already struggling with water quality challenges. Consider working more closely with mutual aid networks or other community-based organizations to identify community members with well or spring water systems vulnerable to contamination.
Article Author: Caroline Reed
Sources
National Oceanic and Atmospheric Administration (NOAA) Climate Prediction Center. ENSO Diagnostic Discussion.https://www.cpc.ncep.noaa.gov/products/analysis_monitoring/enso_advisory/ensodisc.shtml
National Oceanic and Atmospheric Administration (NOAA) National Ocean Service. What are El Niño and La Niña?https://oceanservice.noaa.gov/facts/Niñonina.html
National Oceanic and Atmospheric Administration (NOAA) Atlantic Oceanographic and Meteorological Laboratory (AOML). How Does El Niño Impact the Atlantic Hurricane Season?https://www.aoml.noaa.gov/how-does-el-Niño-impact-atlantic-hurricane-season/
The Weather Channel. Winter Storm Jonas Ranks Among the Biggest Snowstorms in U.S. History.https://weather.com/storms/winter/news/winter-storm-jonas-rank-in-history
Davis, Mike. Late Victorian Holocausts: El Niño Famines and the Making of the Third World. Verso, 2001.
May, Natasha. “‘Compound shock effect’: Why the Middle East Crisis and El Niño Could Spell Disaster in South-East Asia.” The Guardian, June 23, 2026.https://www.theguardian.com/environment/2026/jun/23/iran-war-oil-prices-hormuz-el-Niño-south-east-asia-impact
Reuters. “El Niño Is Coming. Here Is Where the Risks to Agriculture Are Highest.” June 29, 2026.https://www.reuters.com/sustainability/el-nio-is-coming-fao-we-know-where-drought-will-hit-hardest--ecmii-2026-06-29/
WTOV9. Lawmakers Push $250 Million for Clean Water Projects in West Virginia.https://wtov9.com/news/local/lawmakers-push-250-million-for-clean-water-projects-in-west-virginia-west-virginia-clean-water-house-appropriations-army-corps-of-engineers-safe-drinking-water-act-interior-bill-riley-moore-carol-miller
Figure Credits
Figure 1. NOAA Climate Prediction Center. Oceanic Niño Index (ONI) Strengths.https://cpc.ncep.noaa.gov/products/analysis_monitoring/enso/roni/strengths/
Figure 2. NOAA National Ocean Service. What are El Niño and La Niña?https://oceanservice.noaa.gov/facts/Niñonina.html
Figure 3. NOAA maintains prediction for below-normal Atlantic hurricane season https://www.noaa.gov/news-release/noaa-maintains-prediction-for-below-normal-atlantic-hurricane-season
Figure 4. Table created by the author using snowfall totals reported by the National Weather Service Morristown, TN Forecast Office (NWS Morristown). Source data: National Weather Service Morristown, Tennessee.
Figure 5. Food and Agriculture Organization of the United Nations (FAO). FAOSTAT Data Portal.https://data.apps.fao.org/
